为什么会去学内核调试,因为之前学内存管理的时候,介绍过内核调试可以查看进程的物理地址,亲自动手实验,加深理解。
最初看到KD命令行(kernel debug),感觉很神奇,可以查找内存物理地址,查询后发现是内核调试,需要安装软件,然后建立调试环境。
一、安装WinDbg软件
注意:WinDbg软件是安装在主机上的,用于调试测试机。
微软官网下载,Debugging Tools for Windows (WinDbg, KD, CDB, NTSD)
3 ways to get Debugging Tools for Windows
- As part of the WDKDebugging Tools for Windows is included in the WDK. You can get the WDK here.
- As a standalone tool set 【感觉独立模式不错,但是没有xp版本的】If you want to download only Debugging Tools for Windows, install the Windows SDK, and, during the installation, select the Debugging Tools for Windows box and clear all the other boxes.
- As part of the Windows SDKInstall the complete Windows Software Development Kit (SDK). Debugging Tools for Windows is included in the Windows SDK. You can get the Windows SDK here.
记得我下载的是XP版WDK文件GRMWDK_EN_7600_1.ISO,好像不是选择独立模式,将下载好的ISO文件(也叫镜像文件)进行解压。解压出来后,选择Debugging Tools 文件夹就行了。这里已经提取了xp版的Windbg软件,可以直接下载安装。
如果安装出错,可能是缺少类似 Microsoft Visual C++ 2010 Redistributable 等软件
二、配置双机连接
需要两台电脑,一台作为主机,另一台作为被测试机。主机连接到测试机才能进行内核调试。 那没有两台电脑怎么办?
方案一:一台主机,一台虚拟机,虚拟机作为测试机。
方案二:两台虚拟机,一台作为主机,一台作为测试机。
1、开启测试机的debug模式
无论方案一还是方案二,都要开启测试机的debug模式。
对于 Windows XP,直接编辑 C:\\boot.ini 文件。添加新的启动项:
multi(0)disk(0)rdisk(0)partition(1)\WINDOWS="Microsoft Windows XP Professional -Debug" /fastdetect /debug /debugport=com1 /baudrate=115200
其中/baudrate=115200,表示串行通信的速率 bps,115200 是串行通信的最大速率,因此使用串行通信进行内核调试时,如果进行频繁的单步跟踪和要传递较大的文件(如 .kdfiles 和 .dump 命令),那么会感觉到速度有些慢。com1是连接端口号。
最终编辑好的boot.ini文件效果如下所示,
[boot loader]
timeout=30
default=multi(0)disk(0)rdisk(0)partition(1)\WINDOWS
[operating systems]
multi(0)disk(0)rdisk(0)partition(1)\WINDOWS="Microsoft Windows XP Professional" /fastdetect
multi(0)disk(0)rdisk(0)partition(1)\WINDOWS="Microsoft Windows XP Professional -Debug" /fastdetect /debug /debugport=com1 /baudrate=115200
从 Windows Vista 开始,考虑到 boot.ini 文件很容易被恶意软件所修改,因此不再使用 boot.ini 文件,而是使用 Boot Configuration Data—BCD。修改 BCD,需要启动一个管理员权限(Run As Administrator)的命令行窗口。然后使用 bcdedit 命令来编辑 BCD(建议首先将当前启动入口复制一份):
c:\Windows\system32>bcdedit /copy {current} /d "Win7 Debug with Serial port"
The entry was successfully copied to {new_uuid}

c:\Windows\system32>bcdedit /debug {new_uuid} on
The operation completed successfully.
BCD 中有一套全局的调试设置,使用 bcdedit /dbgsettings 可以观察和修改这套全局设置:
c:\Windows\system32>bcdedit /dbgsettings
debugtype Serial
debugport 1
baudrate 115200
The operation completed successfully.
可以看到默认的全局调试设置中,调试类型为 Serial,调试端口为 1,波特率为 115200,这已经是我们需要的设置了。当然也可以通过如下命令再次设置为串口调试:
c:\Windows\system32>bcdedit /dbgsettings serial DEBUGPORT:1 BAUDRATE:115200
The operation completed successfully.
如果希望为某个自启动项设置单独的调试选项,那么可以使用 bcdedit /set:
bcdedit /set {new_uuid} debugtype serial
bcdedit /set {new_uuid} debugport 1
bcdedit /set {new_uuid} baudrate 115200
2、配置虚拟机的连接环境
这个地方是一个大坑,需要特别注意一下。其中方案一的配置和方案二的配置是不一样的,需要特别注意。
方案一的操作:
虚拟机设置方面: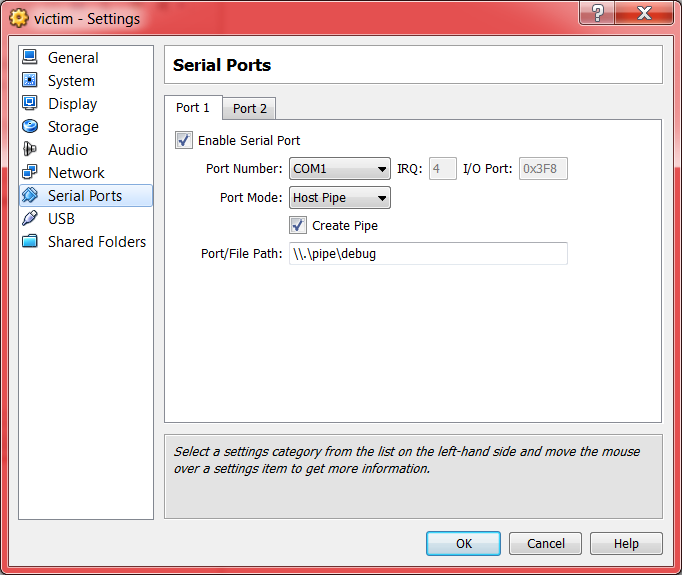
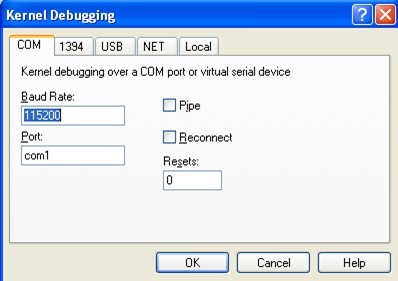
主机操作windbg软件,连接时的配置: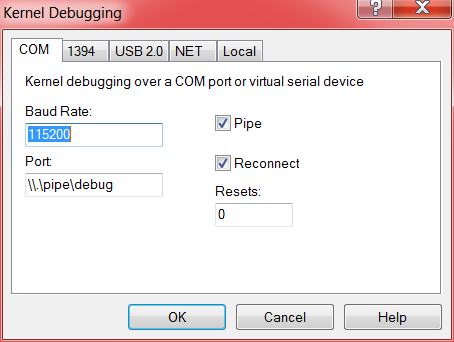
特别提醒:
这种方案里主机肯定是Windows系统,所以pipe管道文件的路径的写法是 \\.\pipe\debugpipe 不像linux系统中的 / xx/xx/ 路径写法。
还有虚拟机实际输出文件是pipe,所以主机的WinDbg配置连接时,需要勾选pipe。
方案二的操作:
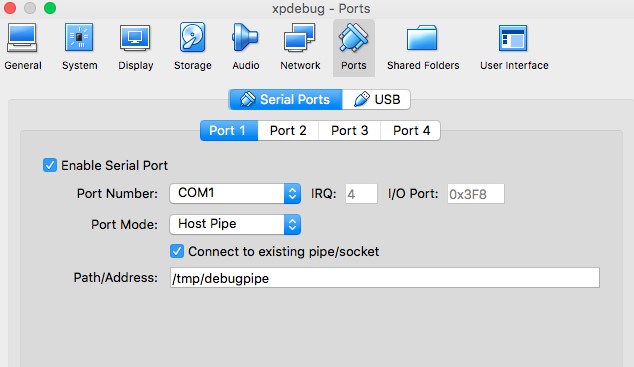
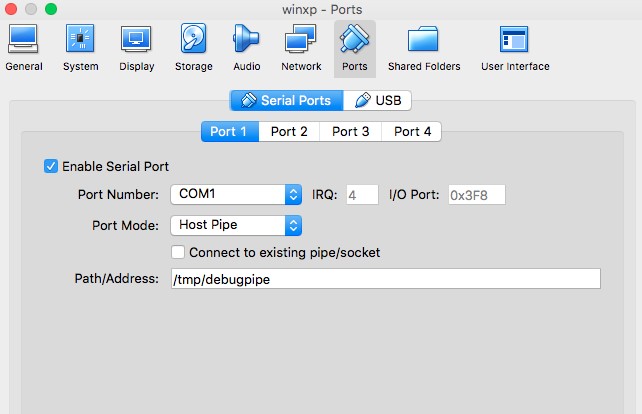
特别提醒:1、“Port Path/Address” 的路径是:/tmp/debugpipe因为我实际电脑主机是mac系统,所以用 “/” 。如果实际电脑主机是Windows的话,那么 “Port Path/Address” 的路径类似\\.\pipe\debugpipe2、虚拟主机和虚拟测试机中,只要有一个创建pipe文件就行了,另一个直接连上已经存在的pipe文件。[大白话就是两台主机的设置界面的connect to existing pipe/socket 只要有一个勾选上就行了]3、虚拟主机用WinDbg连接虚拟测试机时,不要勾选pipe。因为之前两台虚拟机都已经配置过外部信息采用pipe形式,所以虚拟主机的外部已经自动变成pipe形式和虚拟测试机进行信息交互了,不用多此一举。所以虚拟主机连接虚拟测试机时,不需要勾选pipe形式。
三、添加符号(Symbols)文件
1、什么是符号文件
https://docs.microsoft.com/zh-cn/windows-hardware/drivers/debugger/symbols-and-symbol-files
大白话:符号symbol文件,包含全局变量,局部变量,行号,函数入口地址等等,所有的这些东西都叫符号。符号是方便显示调试信息的。
When applications, libraries, drivers, or operating systems are linked, the linker that creates the .exe and .dll files also creates a number of additional files known as symbol files.
Symbol files hold a variety of data which are not actually needed when running the binaries, but which could be very useful in the debugging process.
Typically, symbol files might contain:
Global variables
Local variables
Function names and the addresses of their entry points
Frame pointer omission (FPO) records
Source-line numbers
Each of these items is called, individually, a symbol. For example, a single symbol file Myprogram.pdb might contain several hundred symbols, including global variables and function names and hundreds of local variables. Often, software companies release two versions of each symbol file: a full symbol file containing both public symbols and private symbols, and a reduced (stripped) file containing only public symbols. For details, see Public and Private Symbols.
When debugging, you must make sure that the debugger can access the symbol files that are associated with the target you are debugging. Both live debugging and debugging crash dump files require symbols. You must obtain the proper symbols for the code that you wish to debug, and load these symbols into the debugger.
Windows Symbols

Windows keeps its symbols in files with the extension .pdb.
2、设置符号文件夹路径
https://docs.microsoft.com/zh-cn/windows-hardware/drivers/debugger/using-a-symbol-server
原理就是:我们设置一个存放符号文件的本地文件夹,WinDbg 会自动从 微软的符号服务器中下载符号文件,然后存放到刚刚指定的本地文件夹。WinDbg具体调试时,就会利用本地文件夹的符号文件。
具体操作:打开WindDbg,选择File菜单,找到Symbol File Path 说明:C:\SysCache 是本地下载symbol的文件夹,http://msdl.microsoft.com/download/symbols 是微软符号服务器。
SRV*C:\SysCache*http://msdl.microsoft.com/download/symbols
四、常见问题和简单操作
1、启动顺序问题
方案2中,因为是两台虚拟机,启动时首先要启动创建pipe的那台虚拟机,然后再启动不创建pipe,只连接pipe的虚拟机。
方案1中,因为主机本身就启动了,所以只要启动虚拟测试机就行了。
注意无论是方案一还是方案二,启动虚拟测试机时,都需要选择debug模式启动项,不要选择正常模式启动项啊。
2、debugee not connected
当在主机或虚拟主机上,打开 WInDbg 软件–>file菜单–>kernel debug 选项时,会出现 debug not connetced 。这个是正常现象。因为第一次需要下载symbol 符号文件,然后呢,要进行内核 debug 的话,还要选择debug菜单,执行break操作,这样子才能 完成 两台机器间的通讯连接。
3、常见KD命令
r cr4
读取控制寄存器cr4的内容

!process 0 0
命令查看当前系统所有进程信息

!process 0 0 notepad.exe
查看文本编辑器的进程信息  ,举例如下,其中 Dirbase 是内存页目录表的基地址

kd> !process 0 0 notepad.exe PROCESS 81dbd5a8 SessionId: 0 Cid: 0754 Peb: 7ffd7000 ParentCid: 05e0 DirBase: 0f255000 ObjectTable: e14c47d0 HandleCount: 50. Image: notepad.exe


!dd db9e000
查看 db9e000 物理地址的内存 显示二进制内容 (32位格式显示内存信息)

!dq db9e000
查看 db9e000 物理地址的内存 显示二进制内容 (64位格式显示内存信息)

!db db9e000
查看 db9e000 物理地址的内存  显示ascii编码后的内容
五、VirtualKD
在这里还可以使用VirtualKD自动设置调试。除了自动化之外,VirtualKD的另一个重要特性是性能提升。VirtualKD承诺将Windows内核调试速度提高45倍,这值得花时间进行投资。
由于我不运行Windows主机,我实际上不会这样做; VirtualKD只能在Windows主机上完成,不支持Linux。但是,您可以在此处找到非常好的步骤:http://virtualkd.sysprogs.org/tutorials/install/
参考链接:
https://resources.infosecinstitute.com/introduction-to-kernel-debugging-with-windbg/#gref
https://reverseengineering.stackexchange.com/questions/11367/kernel-debugging-between-two-virtual-machines-not-working
http://neilscomputerblog.blogspot.com/2011/05/vitualbox-kernel-debugging.html
https://www.cnblogs.com/exclm/p/4097576.html
https://www.tenforums.com/tutorials/5558-windbg-basics-debugging-crash-dumps-windows-10-a.html
https://www.tenforums.com/tutorials/5560-configure-windows-10-create-minidump-bsod.html